Monthly Archives: September 2014

Aggregating

Time to start aggregating.. “I have the key, now I just have to find the lock”agg

There’s a fair chance that given the way I’ve calculated my base points, I don’t even have what I want. But I have an idea of what I’m looking for and we’ll see if the data brings any of it to light.


I’ve said it before I think, but I’ll say it again. All of the statistics I have done for the past year pre-transient waves have not provided an edge, but they have provided a lot of background knowledge that’s helpful to simply know how the market moves. Looking at data such as types of bars that follow other bars, times of extremes, etc. yield too large of a range to make a comfortable system out of, but they do show the limits that the markets usually follow. Putting these ideas together into the transient waves helped me create a better picture of what’s likely to happen, now in a scope that can actually be useful.

In going into the meta-data now, I really don’t know what to expect. It’s kind of a blank sheet again as far as what ‘limits’ the data contains, but hopefully, I can find something that confirms what the transient waves have so far shown. (semi) independent tools, same signal.


For fun:

It’s been a long long time since I’ve cared about sharing a forecast, mostly because I never felt comfortable in my analysis, but I think this one has a fair shot actually. This single chart currently contains all of the little odds that I’ve found.

Even though this looks like a very normal down trend move, I believe the expectation to make another down move to be not very likely, at least not yet. For price to actually hit the box would be very cool, although I’m not betting on it. It’s the product of a potential edge that I haven’t even come close to verifying yet. What I do think is very likely though is for price to move up a bit, and create a new transient high, and then for the next transient low to be higher than the current one. A fractal low of transient bars.

agg2

orrrr we’re just heading into the 10% region.

Random note and lesson on research design

Sometimes I wonder where the point will be when I stop sharing my research. I find it easy to follow of course, because I made it all! However, the proper guidelines followed correctly can be true holy grails that should not be open to the public. I think… o_O

That being said I will make the following note about the previous stat and my thoughts in general.


There’s a difference between “if x occurs, what’s the chance that y will follow?” vs “If y occurs, what is the chance that x came before it?”. Often times in fx we look for the first one. “If this candle pattern occurs, what’s the chance that price will reverse?” To me it’s the obvious question, and as such, the market hides it quite cleverly. Initially I wondered what was the use in doing the second type of research. However, doing it in a sort of backwards manners in some fashion forces the market to reveal it’s secrets if done correctly. It’s a bit like philosophy: you start with basic premises that MUST be true (or are taken to be true) and you build on those and go from there. It seems a little silly but if framed right and is further executed right, it works.

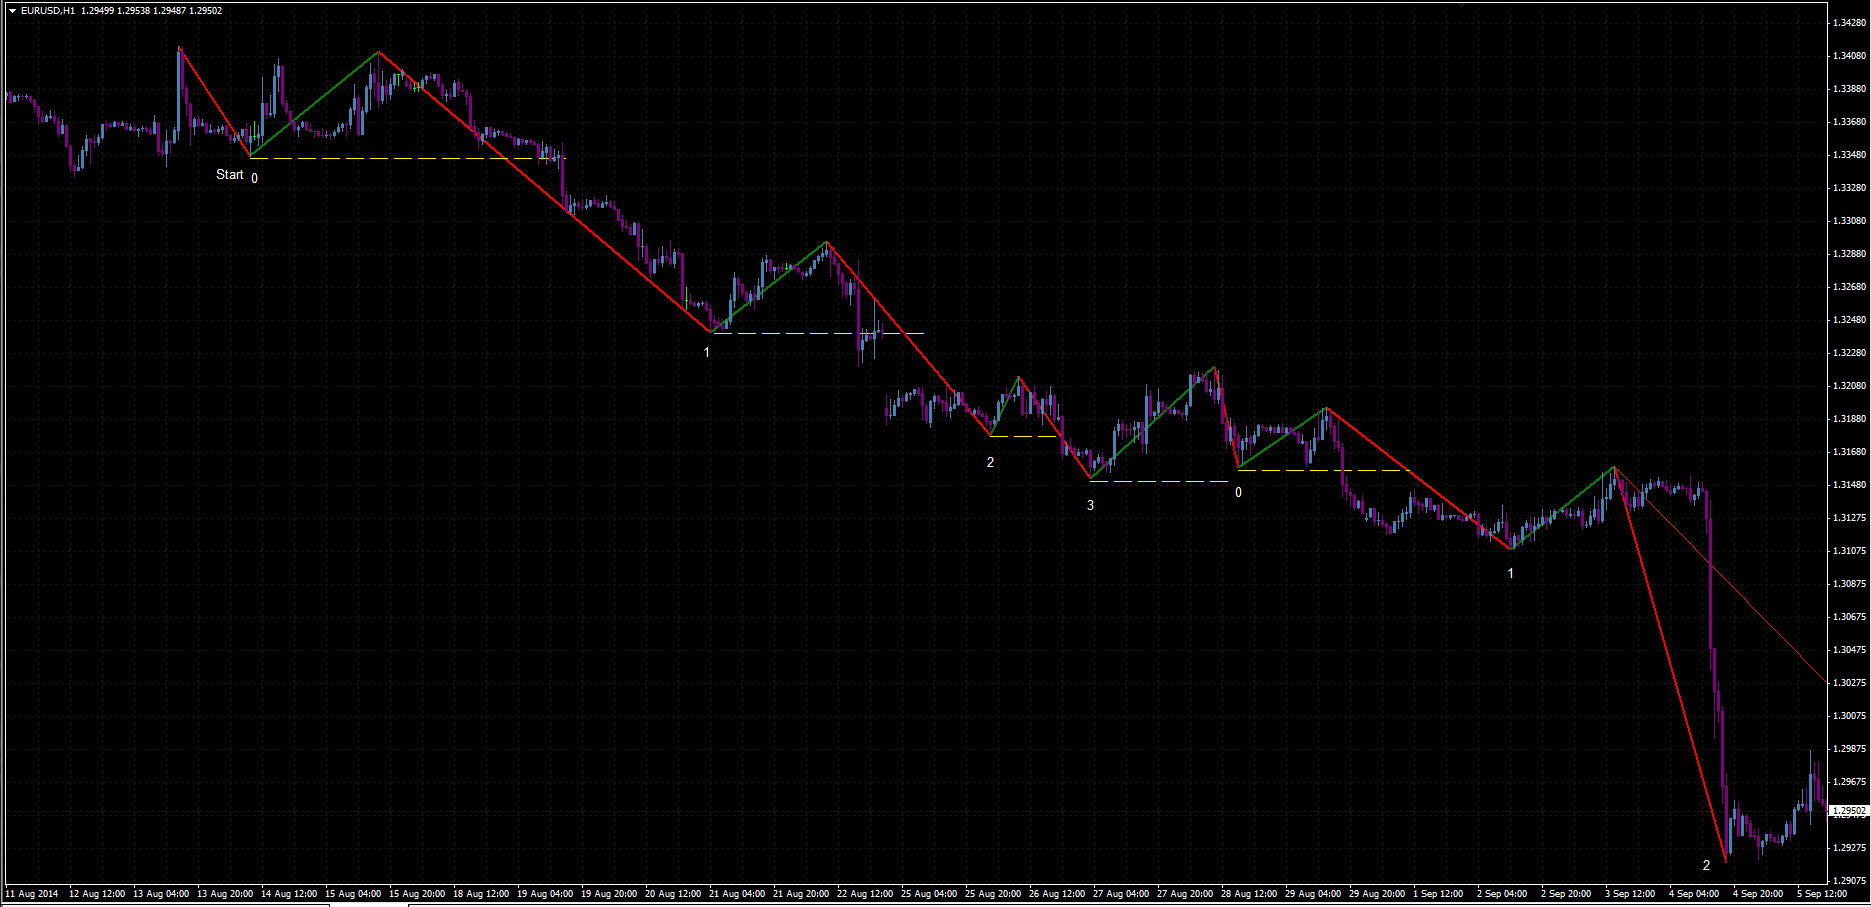
ex. I have always wondered “at what point can I know when the market is turning?”

the answer? It turns. Silly right?

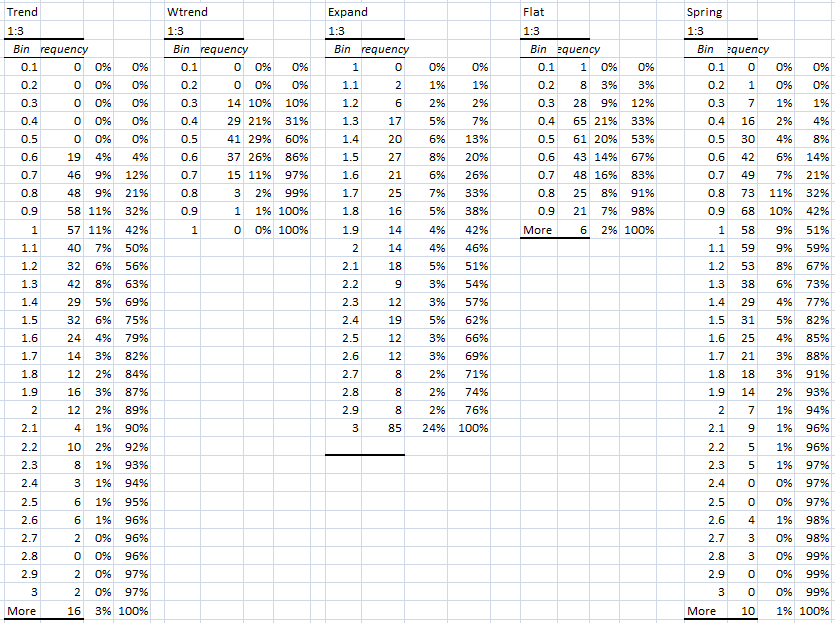
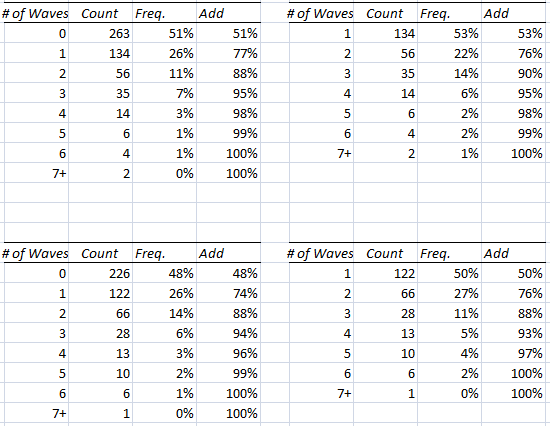
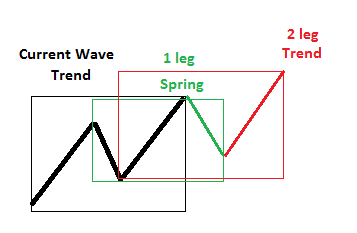
To further improve on this: at every swing top, a higher high MUST be made, and lower low MUST follow. A fractal pattern. for h=24 to be transient, h=1 through 23 must also be transient. There is a statistical bound where if h=x is transient, h=24 is now likely to be transient as well. Well above 50%, and saving much waiting time. This led to wondering if there was a pattern that occurred at tops and bottoms. Traditional candle stick patterns are bogus, or at least without proper context. What is proper context? When it’s contained within the proper wave framework or trend. (I’ve thought that when using too big of a frame, it requires a more significant pattern btw. This is something to look into..) So I ask the question: At the swing points, what kind of pattern occurs? This is type 2 question (If swing occurs, what’s the chance that x pattern came before it?) I get a distribution, which may or may not be helpful. However after this, I can still ask the type 1 question. Or, even better, I can now ask the type 1 question in an even better way (since often times, asking question 1 first will lead to 50-50 or 33-33-33 etc. distributions )! If the distribution from the type 2 question is favorable, I can now hunt specifically for those in question 1. It’s a filter on top of a filter.

Lets say I have 10 candidates for a pattern that is possible in the type 2 question. If I get a rough distribution of 10% on each of them, it’s useless. However, if I get that 4 of those patterns have a combined frequency of 70 or 80% of the possibilities, I’m in business. What I can do now is check the patterns against themselves. If a swing top occurred and Pattern A came before it 20% of the time, then what’s the probability that a swing top occurs after Pattern A? See the difference? Now I have found the exact pattern that still, may or may not prove to be useful, but it certainly will stand a better chance of turning something up compared to trying every pattern from the get-go.

I consider the “candle patterns before transient points” to be already filtered. They’re not true candles, but rather modded to be more accurate, and I think I could do some work to further improve it. What’s shown in the stat is the type 2 framed question, however I have gone on to flip it, and acquire the stats for that. (not shown because i’m still working on it). However, if filtered correctly, even if you can predict that a swing will occur after pattern A with 25% accuracy, that’s the chance of predicting a swing top/bottom. If the average wave length is 200 pips and the required stop is 20 pips, then well, 25% accuracy doesn’t look to shabby when the R:R is 9:1.


Also, thanks to NorthTrader for the vouch in the similarity thread to get me unbanned, although it was kind of nice not responding to anything because I couldn’t :p

Candle patterns at transient points

Tops have a green bar over 90% of the time. Bottoms have a red bar over 90% of the time.

In a 5 bar pattern of true transients, a top contains the pattern UUUxx 80% of the time, while bottoms contain the DDDxx pattern about 80% of the time as well. These seem to be pretty reliable for assuming a possible transient bar before the complete h value is completed.

Capture

Some other patterns are actually also good, considering the proper filter. This is only considering all left side transient bars. Somewhere between 12-14% of left side transient bars are fully transient, therefore making the UUUDD and the DDDUU very good opportunities for predicting the transient vs recurrent type. This is decent, but I’m already having ideas of making this much much stronger. After some thought and live testing, I’m not quite ready to start working on other things. There are still more little details to figure out, and I want to exhaust these basic moves as best as I can before working on the levels and fib aspects. However I do need to work on it because I need my own secret weapon =p

It’s all about proper filters at this point. Finding all the cases that make the norm, not so norm.

Capture1


Revisiting double tops/bottoms, possible re-haitus

I think this is, or is close to the last statistic I plan to post for a while.

I noticed something, and then read it in the similarity thread as well today. Someone had mentioned that in the case of double tops/bottoms, the opposite zone has some attraction strength that needs to be addressed/returned to at some point.

ex. Assume transient top occurs. Price spikes down, then sits in a range. Price moves up again later, and forms a second transient top, without a transient bottom between them. What’s the chance that price will revisit the lowest low between the two transient high points?

revisit

Results show that in those scenarios, price revisits the in between point about 67% of the time (0 indicating never returned to)

I’m surprisingly satisfied with my general framework with T-bars and T-waves (did I just invent a glossary?), and now I want to key into some other parts: entry, exit, retracements, extensions, etc. I think I’ve found my edge! Now I have to refine it to the point where it’s comfortably trade-able, and not just playing the statistics of where the general direction of price will end up. I want to be on demo/small live for a while to get a feel for it and see what areas I like and don’t like, which will lead me to have more specific areas that I want to see if I can learn more about. Doing so I think will require a bit more creativity and ‘bizarre’ tactics. I always wanted to mess around with SB stuff, but finding anything just seemed so difficult; it’s not that I don’t want to put in the time, but rather I want to have a solid base before I ventured into other areas.

general ideas I want to look into:

Rectangles, DV, TCD extensions(dominant/subordinate life cycle), overfill, wave slopes, momentum equalizing, “smeared” price, launch/magnet points, pivots.

Coming up with a way to design and test these will take a long time, if ever even attempted, so I don’t plan on having much to share for a while.

Until then!

Timing on recurrent bars

Didn’t even really think about this one until recently, I believe because I was focused on something else. However now with the adapted style of needing (wanting) to know the differences between a bar being recurrent or transient, it’s nice to know.

This is tracking recurrent bars for h=24. If a bar is left side transient, but not fully transient, which bar makes it recurrent? (hours after the LST has appeared)

recurrent

As expected, nearly half(the majority) of the bars that are left side transient are made recurrent in the next hour. This is due to momentum being built, aka not just a single consecutive bar, but multiple. What’s more important to me atm is the extreme side. The odds spike down as time goes on; anything after 8 hours is really not too common.


2018 edit: I realize that this does not answer the question that I really should have been asking, perhaps because it’s much more abstract; for every bar n past the point where bar 0 could have been a transient point, what is the probability that bar 0 is actually transient? For example, if 00:00 printed a possible transient bar, and that bar is not recurrent after 8 hours, what is the probability that the 00:00 bar is transient? I can see why I didn’t pursue this, as it begs the question ‘is this tied directly with price away from bar 0’?

Basic ratios on Transient waves

Time to dust off the micro account.

4

5

6

Combined with the likely wave type to follow, I think there’s a window of edge that is trade-able.

steps left for now:

1. Poor man’s version of RB sorting
2. Look into T-bar vs R-bar differences a bit more
3. Possibly add numbers into “on screen statistics” =O

3. Go play with the rectangles again.

Waves 2.1, differing h values

I’m not sure that the question of which h value is correct is one that can be solved. Still, it’s important to know which one is ‘in control’ and which one is acceptable to use. To answer this question, I think you can get around it by using some form of the “wave mutation” and “HTFs”.

Outlining the thought process:

1.There is no such thing as a swing that isn’t, at a minimum, h-transient for the h value of 1.

2.Of course, trading this way is extremely if not straight out impossible. Therefore, you have to find a high enough h value (such as the one that offers the 97/3 ratio) that creates good sized swings.

3. The issue with using higher h values is the existence of the double top and bottoms. Or to be more specific, the existence of double tops and bottom occurring within the h zone and thus creating a swing that perhaps should be considered, but is not due to it’s speed. (yes I know RB deals with this =p )

4. Solving this using standard TFs stems from the question of knowing which TF is in control, or which h value is in control.

5. One can, of course, disregard the bump in the double top/bottom as the statistics would already account for not trading these opportunities, but it can be a bit dicing when attempting to trade away from an H zone before it has completed. It seems to be that the most passive/safe way to play with this trade style is to pick mid trends, rather than the ends. Of course, this creates the issue of safe exit and safe SL ratio..

6. If I picked an h value of 40, I believe roughly 20% of the transient bars will be next to another bar of the same wave type (aka, 2 top t-bars without a bottom t-bar between them). However, it seems that even if I lower the h value to 20, I would still end up 20% of the bars behaving like that. So, I don’t think I can find locate a t bar, and then safely declare that price must create a t bar of the opposite direction before returning to the first direction. See why that would be useful though? Actually to be honest, I only tested 2 numbers and ended up with the ~20% figure, perhaps there is something more to this idea.

7. Yet, even with this fact, it still must be true that for some double top/bottom, there exists an h transient bar between them for some value of h>=1. I think that if I plotted all the h=40 t bars and the h=20 t bars, a lot of the double tops/bottom created by the h=40 would be “solved” by the h=20. How many? I don’t know…


Wave Counts

I liked the trend spotting thread; Good, short, simple, and thought provoking.

http://www.forexfactory.com/showthread.php?t=227948

My immediate idea was to apply to waves rather than just bars. However, I didn’t quite like the idea that the numbers jumped from say 4 to 19 depending on how many more prices the new high or low broke. I wanted a simple method of potentially letting me know when a trend would stop or at least halt, and while this method isn’t it, it was close enough to give me the right idea (for this initial phase).

Similar to the Barros LCC (line change count), but again, I wanted to use the wave as a whole.

wave count

Top is for up waves, bottom is for down waves.

The results seem to suggest that flats are a constant in “breaks” during a trend. One thing I like is that extremes show more clearly. I know very well when price should stop to make a lower high or a higher low, rather than seeing constant bars of 99+ as I would if I implemented the indicator provided in the thread.

ex

After the 3 count, a “break” from lower lows is needed, even if for just a bit.

Signal to reverse seems like it will be much harder to crack.

Wave modeling 2.1

Nostalgia to me a year ago reading the forums and seeing wave types and wondering “how will I ever make that?”

wave types

Edit:

I’ve decided to add an additional category, FTrend, or fake trend. I defined it to be anytime the third leg does not exceed the first leg, or other wise known as the additional logic of 3>1 to be a Trend, and 1>3 as FTrend.

1

If there is an assumption that there’s a difference between Trend and Ftrend on future development, the the left section is the correct one to be reading. if they are assumed to be the same, the right one is correct. Either way, it’s really showing the strength of trend following, which honestly is a bit strange to me. It makes sense, but you would think that if it was so clear and so well taught, more people would be successful using it.

Likely scenario:

Projection Legs

Next, I want to take a dig into the Trend Spotting thread that was linked in the Similarity thread. Interesting that Mr. Patrick was active in that thread when it was created in 2010, would love to know some of your thoughts on it if you played around with it (: